Air quality and wildfire visualisations#
Satellite data can provide views on the impact of human activities.
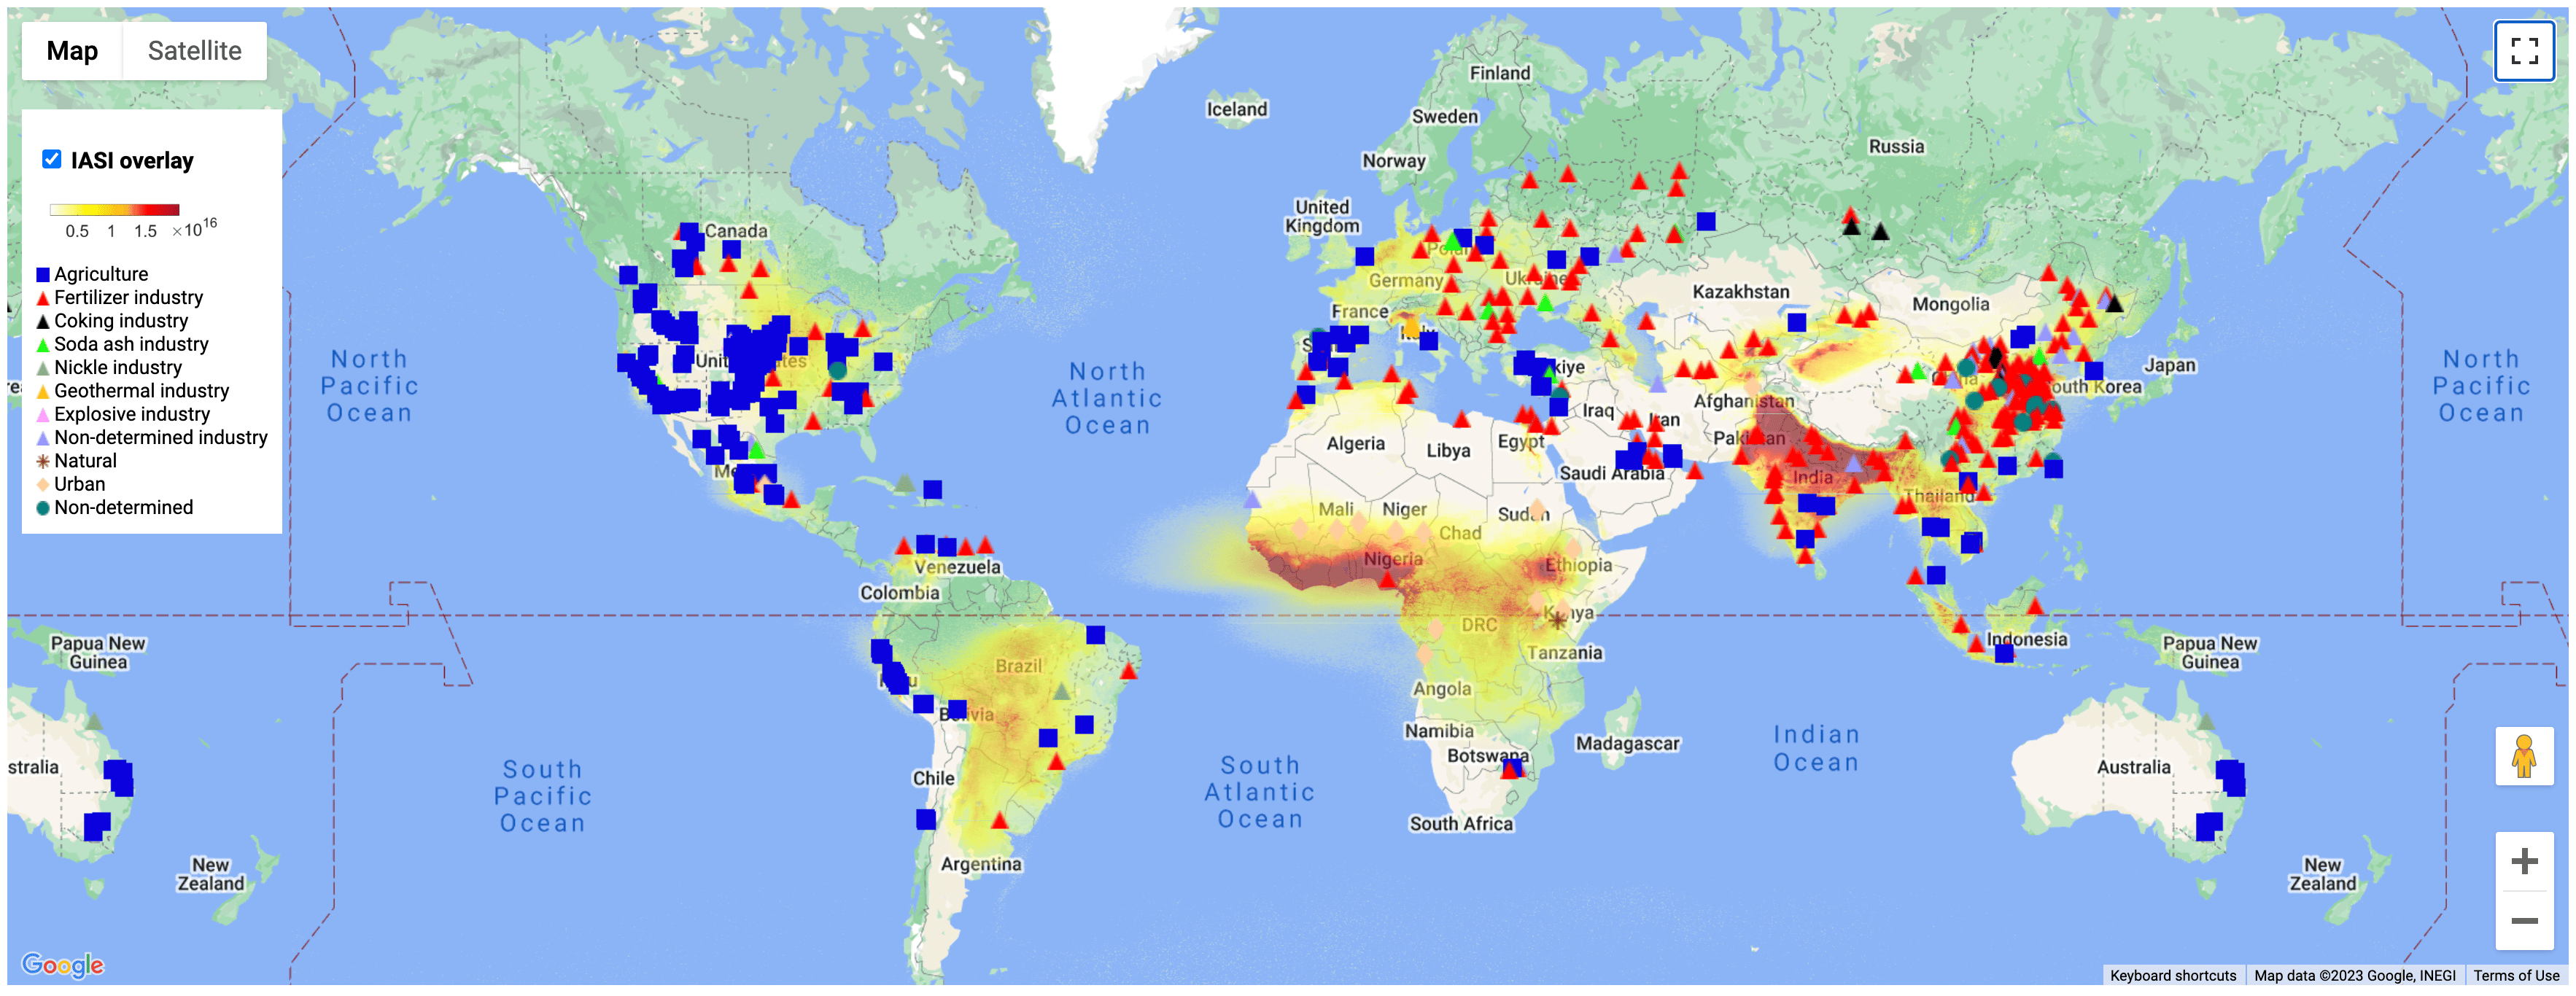
Ammonia concentration measured by IASI, overlaid on a map of likely production sites (Credit: Lieven Clarisse and Martin Van Damme).#
Satellite data can be used to show things the human eye cannot readily perceive - like concentrations of pollutants in the air.

Nitrogen dioxide measure by Sentinel-5P (Credit: ESA).#
Satellite images can provide perspective on the extent of events in the current news cycle.
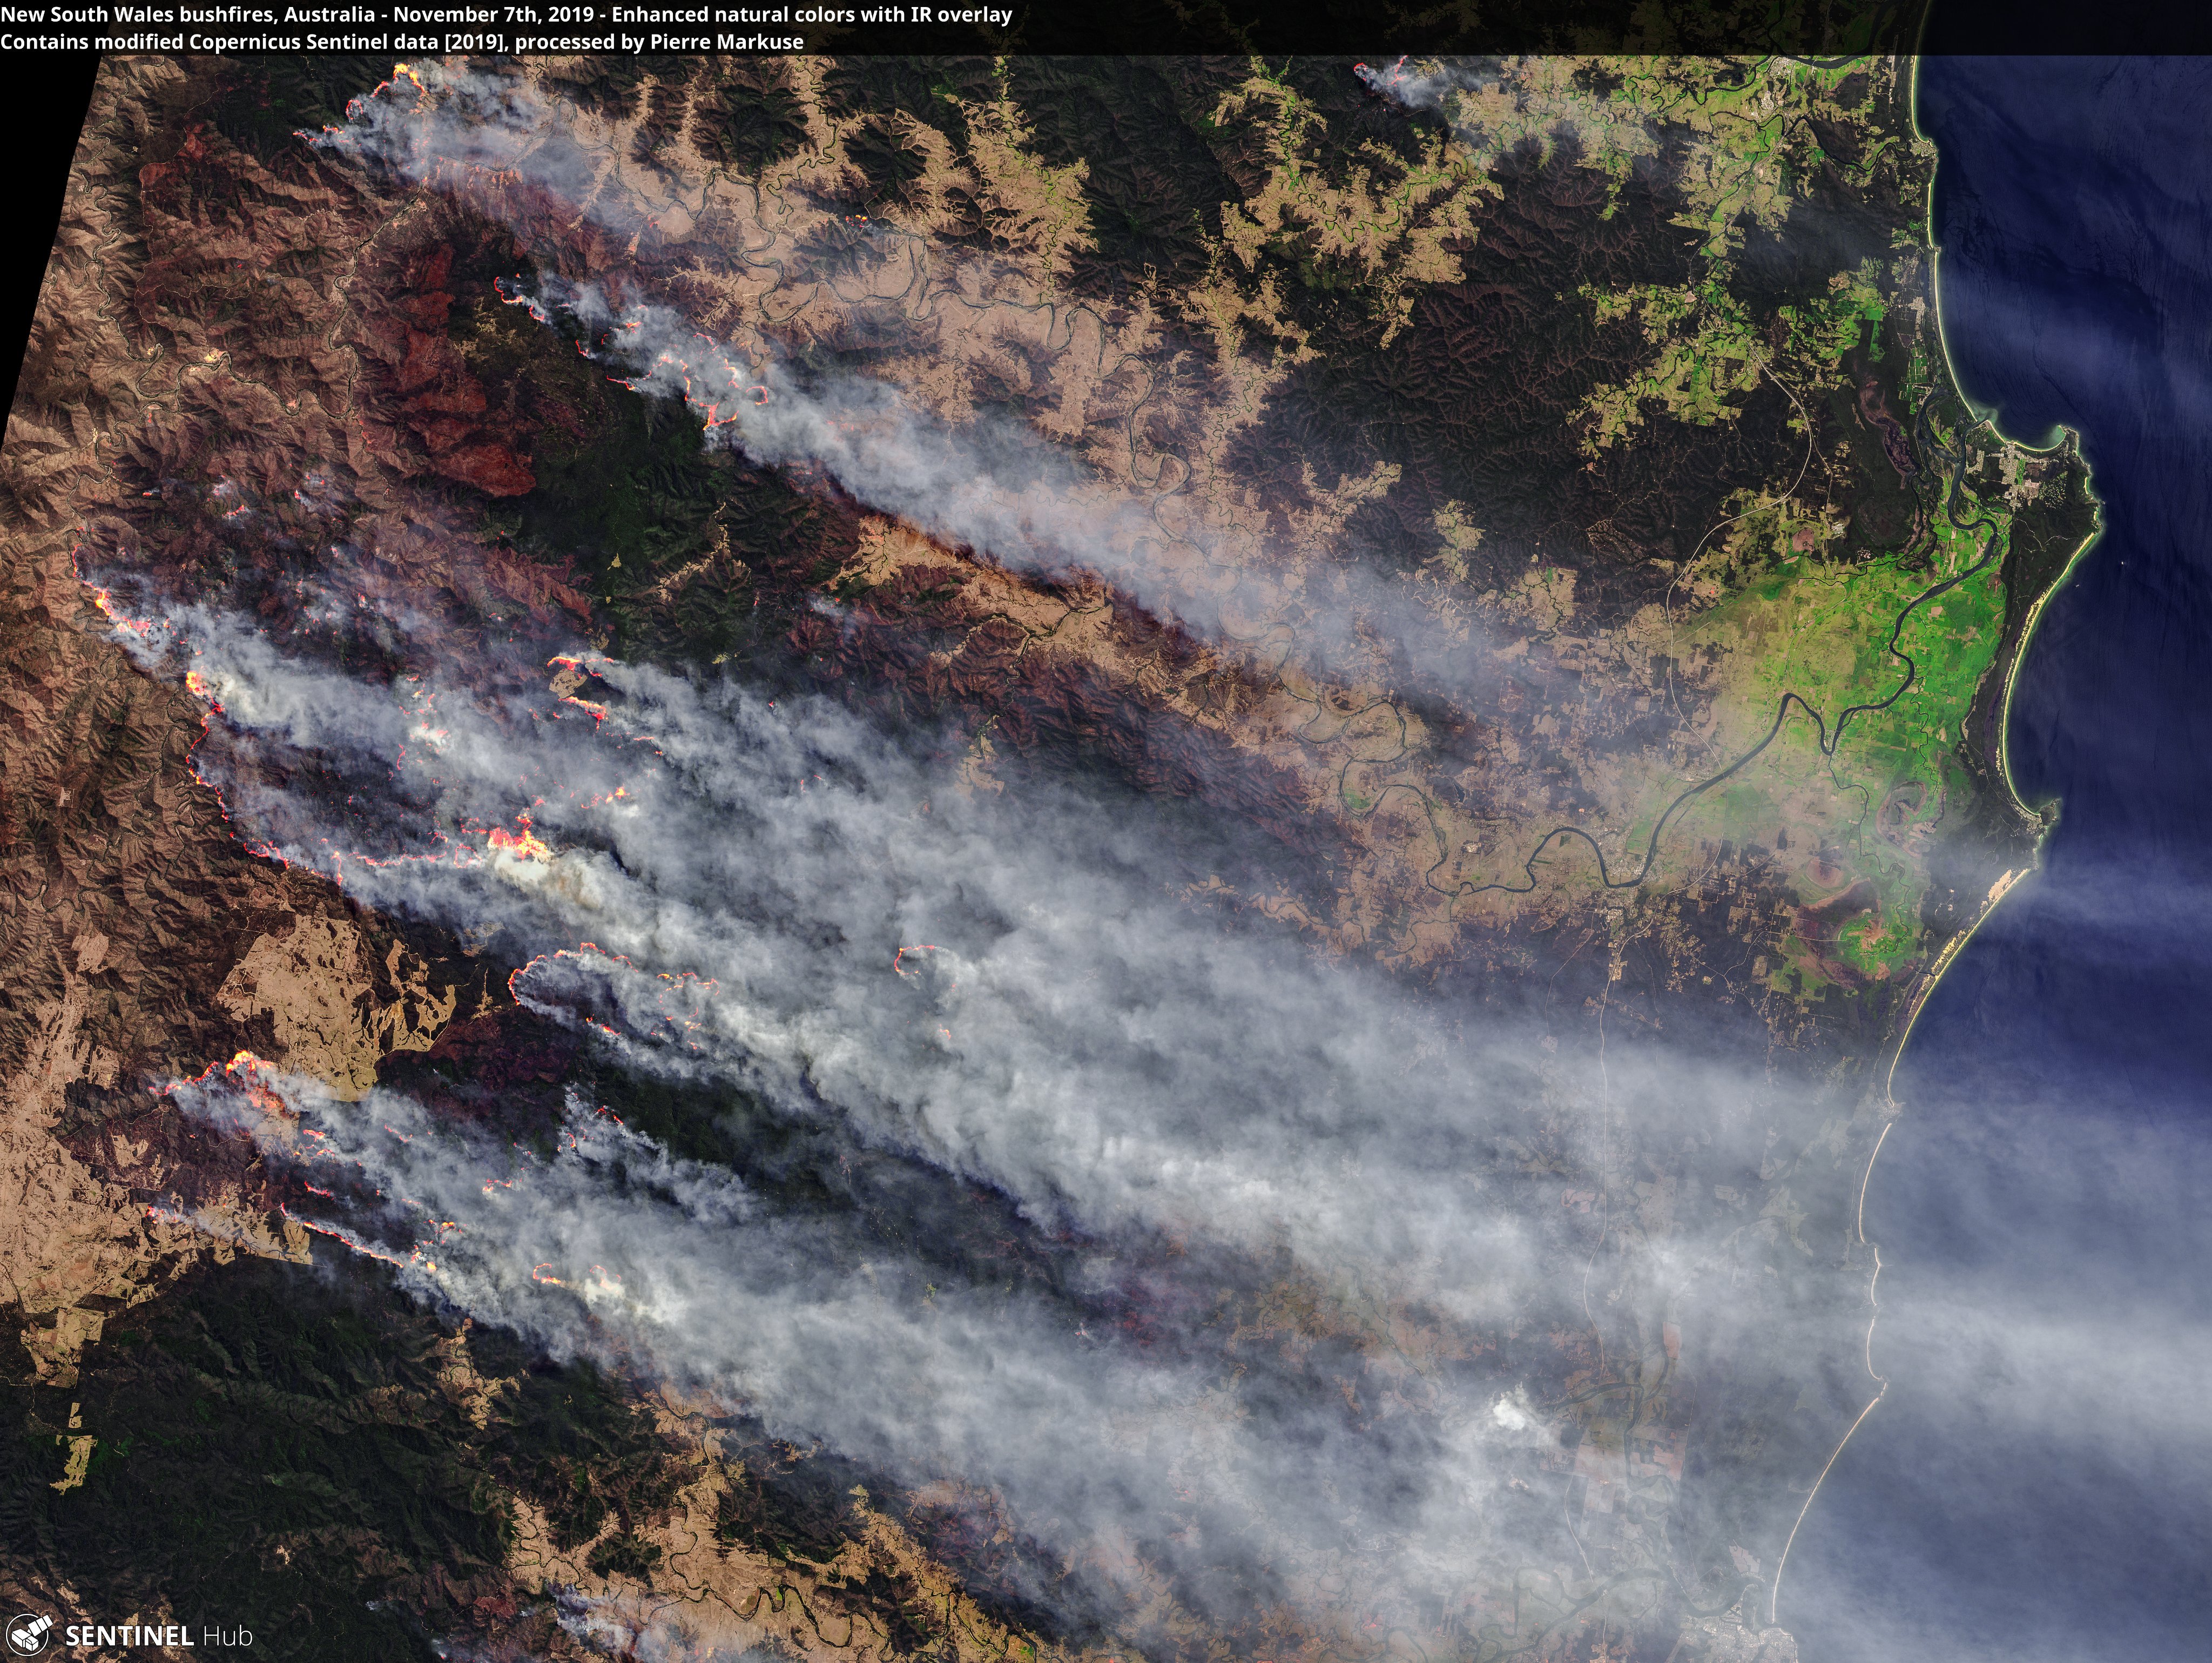
Wildfire extent captured in the visible and short wave infra-red by Sentinel-2 (Credit: Pierre Markuse).#
Satellite data can visualise problems that are invisible to humans and occuring in remote regions.

Evolution of the ozone hole (Credit: Copernicus Atmospheric Monitoring Service).#
Satellites can provide multiple perspectives on a phenomenon. This visualisation combined both visible and infrared measurements to highlight a lava flow in the context of the surrounding region.
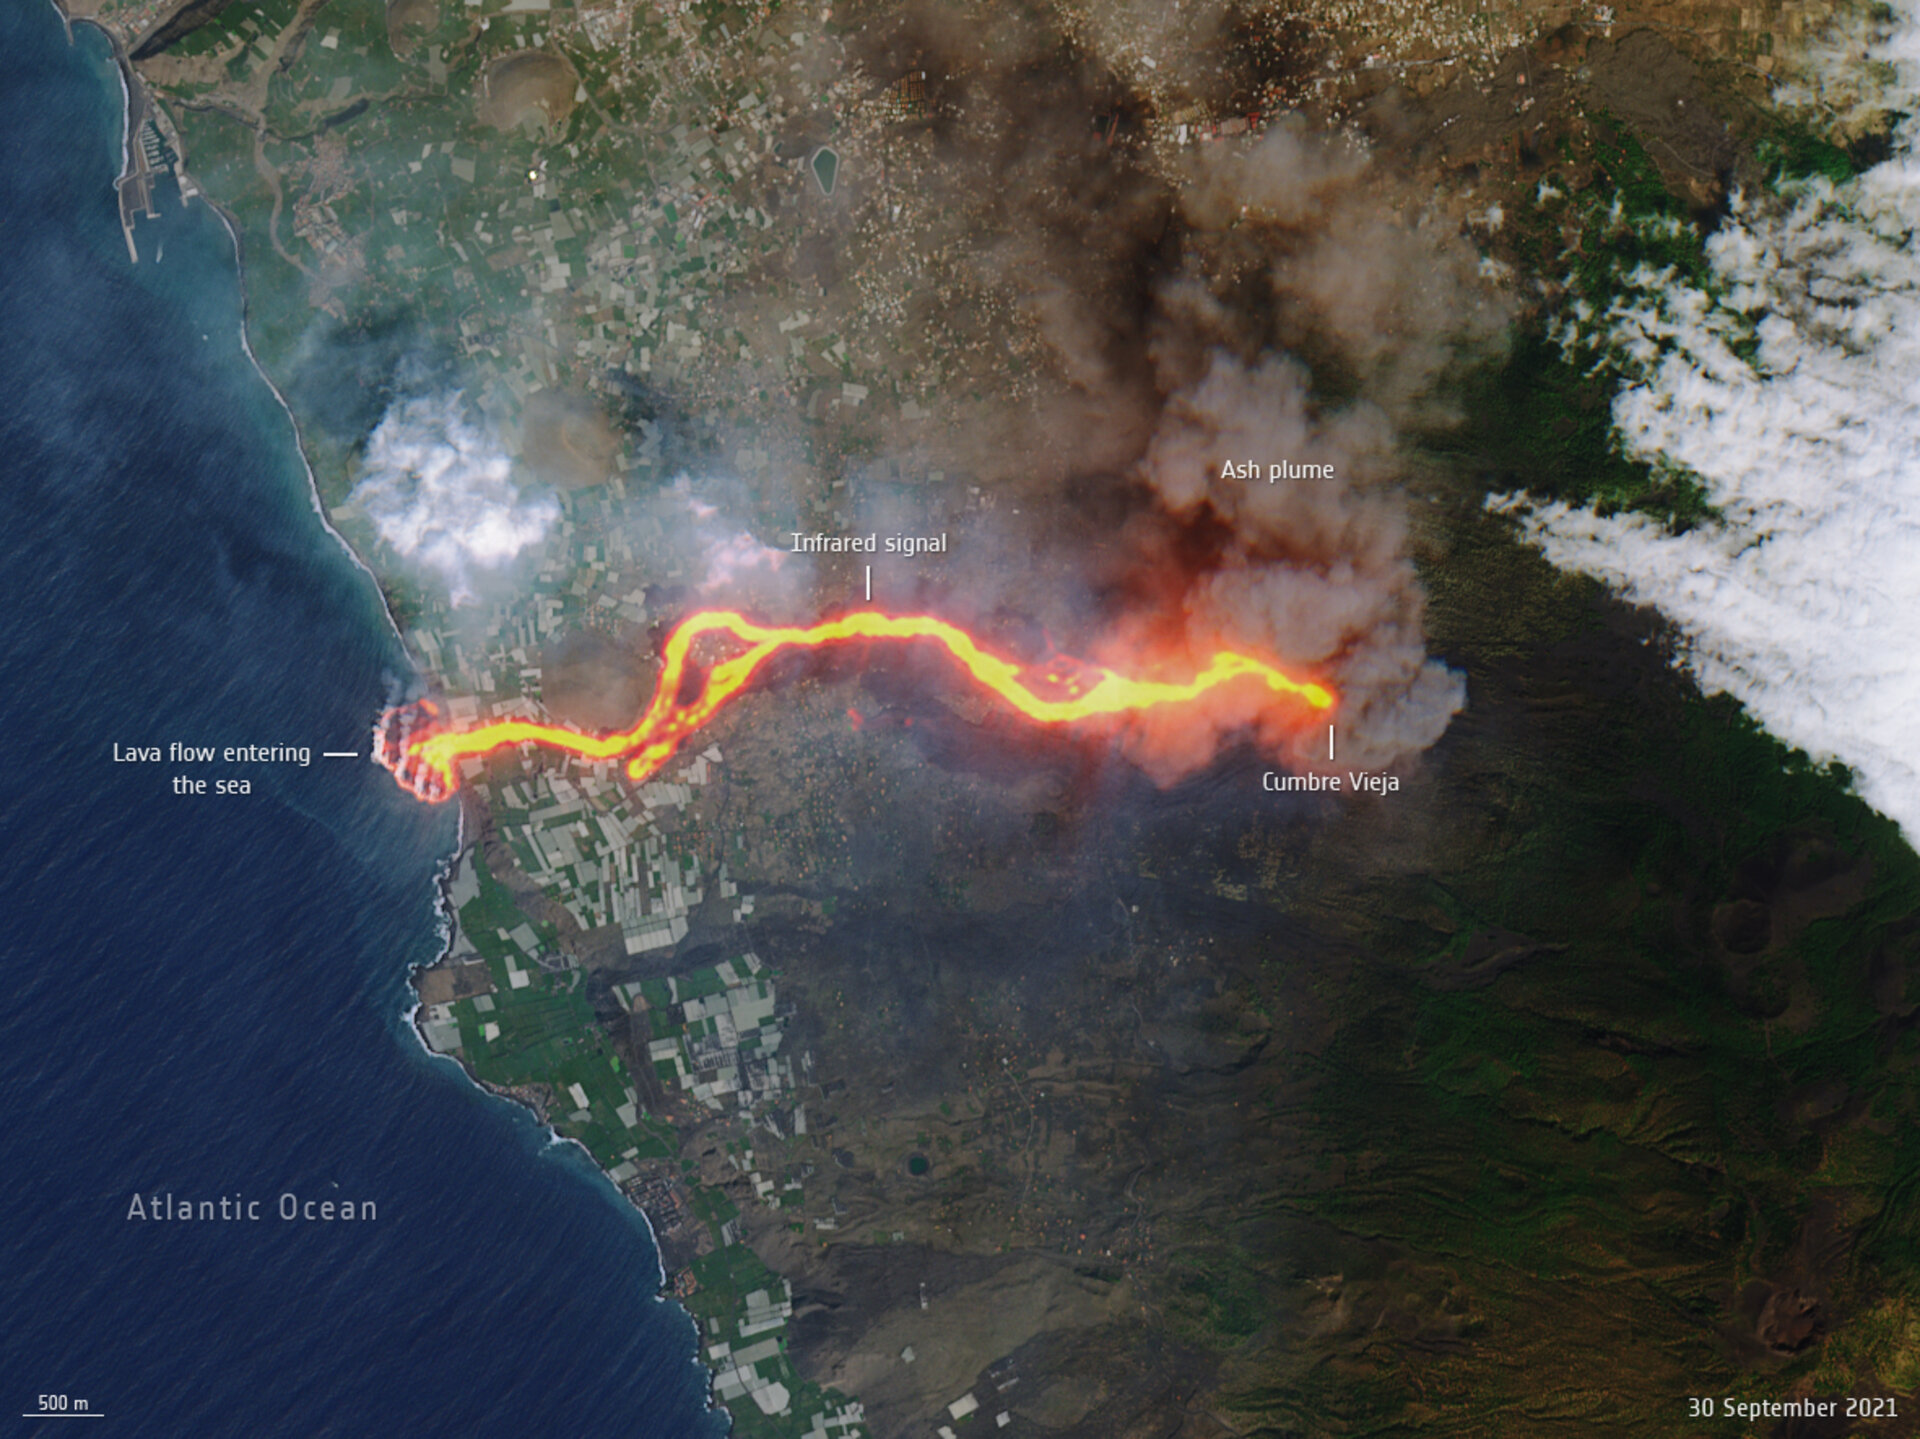
Lava flow and ash plume from the La Palma Volcano, captured by Copernicus Sentinel-2 (Credit: ESA).#
