Journalists’ perspectives on environmental stories#
Journalists are increasingly working with Earth observation data to illustrate environmental stories.
Earth observation offers the opportunity to amaze the public with things they have never seen, to observe extremes, or to be connected to distant places on a daily basis.
Journalists are confident using Earth observation data and as well as visible optical imagery via viewers, many will work with advanced time series data and radar and thermal data to complement articles.
Human interest stories, where Earth observation data can illustrate the scale and extent of impacts of environmental phenomena are, of course, popular. floods, storms, fires, and earthquakes are more and more frequently being illustrated with satellite imagery. Frequently this data is also used directly in these contexts to protect lives and livelihoods, though this is not always included in the media stories.
Further themes for stories involving Earth observation relate to new sensor technology, such as the new lightning imager on the MTG-I1 satellites (BBC News).
Similarly, there is a lot of interest in unusual events or observations such as particularly large volcanic eruptions and icebergs.
Another related aspect that is appealing in the media, is visualising change. Earth observation data can be used to provide before and after data associated to rapid changes e.g. in glaciers or lakes, or as a result of human actions. Whilst appealing these stories are approached by thorough journalists with caution, to ensure that change is communicated in the appropriate context.
Examples of some of these stories can be found in the example stories section of this good practice guide, and recommendations on what makes a good Earth observation data visualisation for journalists can be found in the What makes a visualisation..? section.

Global air quality; particulate matter concentration (Credit: Der Spiegel)#

Floods in Pakistan from Copernicus Sentinel-2 (Credit: Le Monde, Copernicus)#
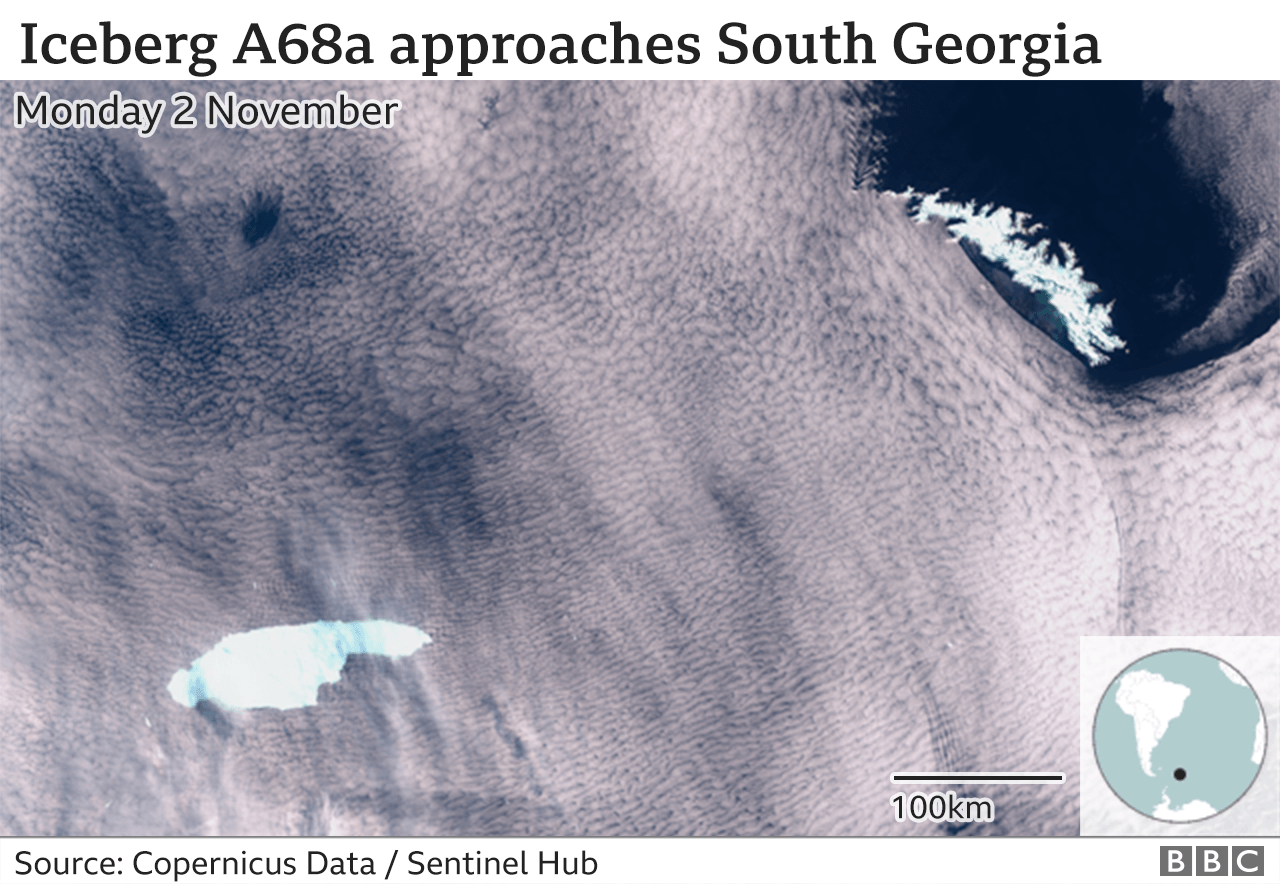
Following the trajectory of the A68a iceberg with Copernicus Sentinel-3 OLCI (Credit: BBC)#
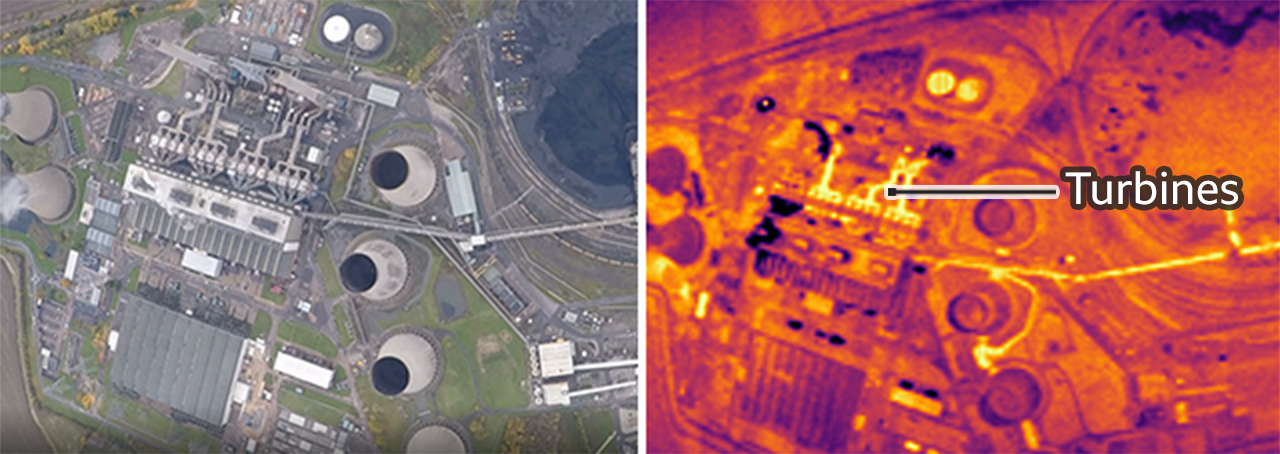
Mapping industrial activity in the infra-red with HotSat-1 (Credit: BBC)#
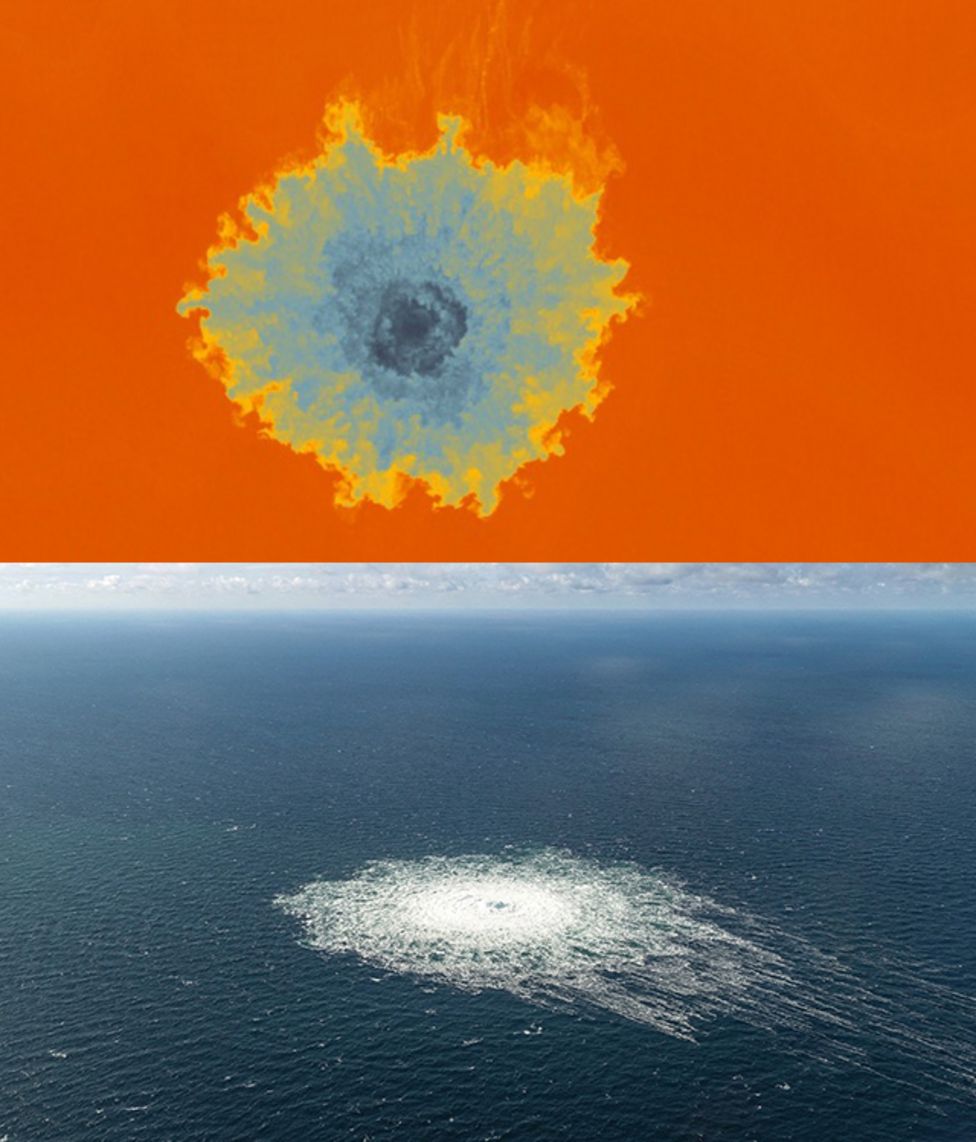
Capturing the Nordstream pipeline leak in the infra-red with HotSat-1 (Credit: BBC)#

Mapping glacial coverage with Copernicus Sentinel-2 (Credit: Washington Post)#
